


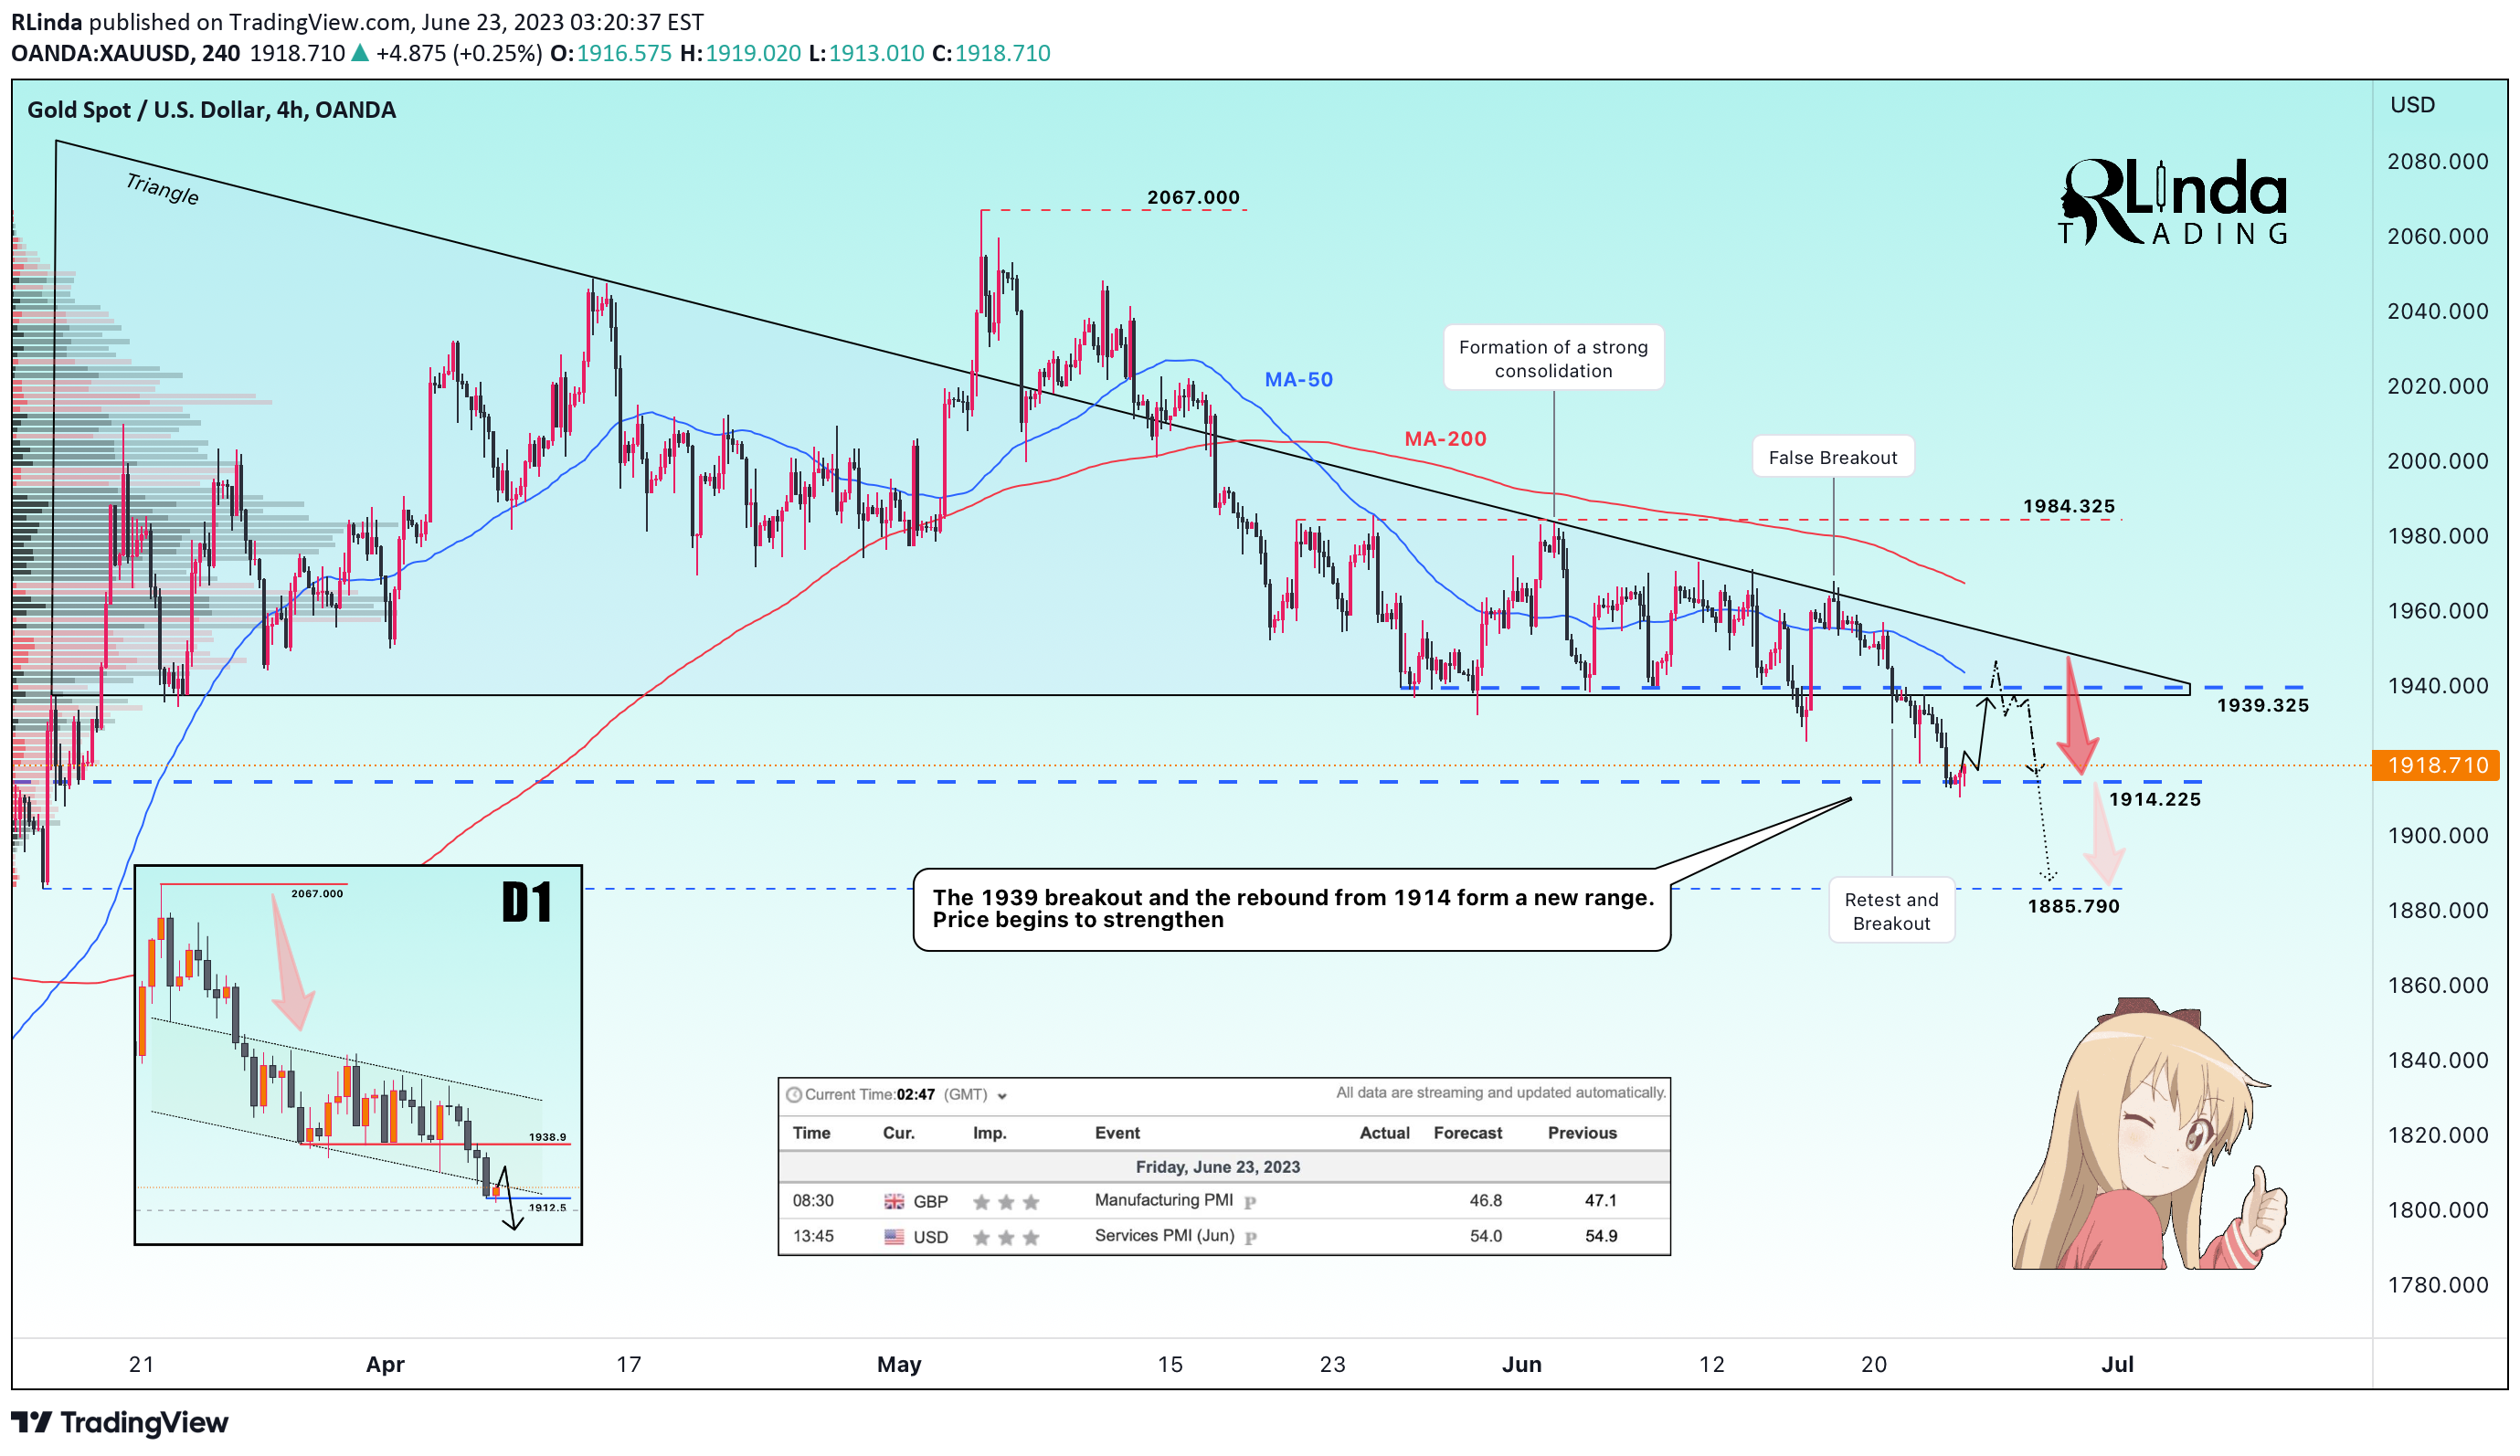
GOLD quickly enough reaches the specified target of 1914 and forms a bullish rebound after a false breakout.
The price forms a range of 1939-1914, within which it can reach local resistance by the end of the session
The daily timeframe hints that the fall will continue. The price exits the local descending range downward, breaking the support (another view is a break of the triangle support), after which a correction is formed - which is a logical component of trading. And the daily candle on Thursday closes at the very low, which suggests that the potential is not yet exhausted. The gold market is bearish right now.
Today's publishings are:
8:30 GMT Manifactruting (GBP)
13:45 GMT Services PMI (USD)
Resistance levels: 1925, 1939.
Support levels, 1914.
The daily candlestick forms a local level - the low of the day. If price breaks this local support, it will head much lower, as there is a void under 1914 on the chart, but within the trading session a rebound could lead to a strengthening to 1925 or to 1939